library(tidyverse)2 Quantitative Sensory Testing
Quantitative Sensory Testing (QST) is a set of standardized psychophysical assays that assess how pain is processed. In A2CPS, we use QST to characterize each participant’s pain-processing “profile” before surgery, on the hypothesis that these profiles help predict who goes on to develop chronic post-surgical pain.
A2CPS collects three complementary QST assays, and each one is tested at both a surgical index site (near where surgery will occur, i.e., the knee for the TKA cohort and the chest for the thoracic cohort) and a remote site (the contralateral deltoid, which serves as a control location):
- Pressure Pain Threshold (PPT): the pressure at which a steadily increasing force first becomes painful, measured with a Wagner algometer over three repetitions per site. PPT is a measure of static pain sensitivity. Note that higher PPT values mean less pain sensitivity (more pressure was needed before the participant reached pain).
- Mechanical Temporal Summation (MTS): the increase in pain over a train of ten identical pokes delivered at 1 Hz with a Neuropen. MTS captures pain facilitation, i.e., the tendency of the central nervous system to amplify repeated input. Higher MTS means greater facilitation.
- Conditioned Pain Modulation (CPM): the change in PPT after a conditioning cold-water hand immersion. CPM captures descending inhibition, i.e., the “pain inhibits pain” mechanism. Negative CPM scores indicate that inhibition is present.
For each assay, the cleaning workflow computes a primary and a secondary outcome, and for PPT and MTS these are reported at both the index and the remote site. The exact definitions follow the A2CPS Manual of Procedures:
| Biomarker | Primary outcome | Secondary outcome |
|---|---|---|
| PPT | Mean PPT at the index site | Mean PPT at the remote site |
| MTS | Mean of 3 difference scores (Max minus initial) | Mean of 3 wind-up ratios, (Max + 1)/(initial + 1) |
| CPM | % change: (pre minus post)/pre × 100 | Difference: pre minus post |
2.1 Starting Project
2.1.1 Locate Data
Where are the relevant files?
$ /corral-secure/projects/A2CPS/products/consortium-data/pre-surgery-release-2-1-0/qst/reformattedThe reformatted data are split by cohort: reformatted_tka_qst.csv (knee) and reformatted_thor_qst.csv (thoracic). Each one carries the raw per-repetition pain ratings plus the computed biomarker columns, and comes with updated_qst_dict.csv, which lists the original REDCap field names alongside the fields added during cleaning.
2.1.2 Extract Data
The files are plain CSVs, and here we use the tidyverse. We focus on the TKA cohort.
qst <- read_csv("data/pre-surgery/qst/reformatted/reformatted_tka_qst.csv")The eight derived biomarker columns for the TKA cohort follow a consistent naming scheme: primary_ or secondary_, then the assay (ppt, ts, cpm), and for PPT and MTS the site (index or remote).
qst |>
  select(record_id,
         primary_ppt_tka, secondary_ppt_tka,
         primary_ts_index_tka, primary_ts_remote_tka,
         secondary_ts_index_tka, secondary_ts_remote_tka,
         primary_cpm_tka, secondary_cpm_tka) |>
head()| record_id | primary_ppt_tka | secondary_ppt_tka | primary_ts_index_tka | primary_ts_remote_tka | secondary_ts_index_tka | secondary_ts_remote_tka | primary_cpm_tka | secondary_cpm_tka |
|---|---|---|---|---|---|---|---|---|
| 10001 | 0.630000 | 0.8133333 | NA | NA | NA | NA | -66.39344 | -0.5400000 |
| 10003 | 2.160000 | 3.3233333 | 1.666667 | 0.8333333 | 1.916667 | 1.833333 | 10.83250 | 0.3600000 |
| 10004 | 1.820000 | 3.3033333 | 0.500000 | 1.3333333 | 1.500000 | 2.000000 | 23.41070 | 0.7733333 |
| 10005 | 7.590000 | 9.0000000 | 4.000000 | 0.6666667 | 5.000000 | 1.666667 | 12.48148 | 1.1233333 |
| 10006 | 4.966667 | 6.8300000 | 1.666667 | 0.6666667 | 1.722222 | 1.666667 | NA | NA |
| 10007 | NA | NA | NA | NA | NA | NA | NA | NA |
Next, check that the biomarkers are stored as numbers. glimpse() gives us a quick column-by-column view of the data types.
qst |>
  select(record_id, starts_with("primary_"), starts_with("secondary_")) |>
  glimpse()
Rows: 1,042
Columns: 9
$ record_id <dbl> 10001, 10003, 10004, 10005, 10006, 10007, 1000…
$ primary_ppt_tka <dbl> 0.6300000, 2.1600000, 1.8200000, 7.5900000, 4.…
$ primary_ts_index_tka <dbl> NA, 1.6666667, 0.5000000, 4.0000000, 1.6666667…
$ primary_ts_remote_tka <dbl> NA, 0.8333333, 1.3333333, 0.6666667, 0.6666667…
$ primary_cpm_tka <dbl> -66.393443, 10.832497, 23.410696, 12.481481, N…
$ secondary_ppt_tka <dbl> 0.8133333, 3.3233333, 3.3033333, 9.0000000, 6.…
$ secondary_ts_index_tka <dbl> NA, 1.916667, 1.500000, 5.000000, 1.722222, NA…
$ secondary_ts_remote_tka <dbl> NA, 1.833333, 2.000000, 1.666667, 1.666667, NA…
$ secondary_cpm_tka <dbl> -0.5400000, 0.3600000, 0.7733333, 1.1233333, N…2.1.3 Data Quality
Several cleaning steps have already been applied, and it helps to know what they are before we start:
- Test records removed. Only completed assessments (
qst_mcc1_v03_complete == 2) are kept, and we keep the most recent repeat instance, so we get one row per participant and visit. - Biomarkers need complete component data. Each biomarker is computed only when all of its underlying pain ratings are present, and a mean over three repetitions is missing if any one repetition is missing. So expect a modest number of missing biomarker values even among completed assessments.
- CPM primary (% change) has extreme values. Dividing by the pre-immersion PPT means a small baseline can blow up the percentage (values below -300 show up), while the secondary CPM (a simple difference) stays within the limits determined by the values.
- Error report. The cleaning workflow produces an error report that flags discrepancies between the double-entered pain ratings and other internal inconsistencies. It is worth a look before you dig into the data.
2.1.4 Cross-Modality Links
Every file includes record_id and guid, which uniquely identify a participant and let us link the QST data to other A2CPS modalities. QST is especially tied to imaging: the cuff-pressure calibration used to evoke a target pain level in the scanner is shared between the two modalities, and the QST cleaning workflow already joins the relevant imaging cuff fields. To combine QST with another modality, we join on the shared identifiers:
inner_join(qst, other_modality, by = intersect(names(qst), names(other_modality)))2.2 Exploratory data analysis
The three assays are meant to capture different pain-processing mechanisms: static sensitivity (PPT), facilitation (MTS), and inhibition (CPM).
We reshape the primary biomarkers into a long format and plot their distributions. Note the different scales: PPT and MTS are on a pain or pressure scale, while CPM % change is unbounded and heavy-tailed.
primary <- qst |>
  select(record_id,
         `PPT (index)`      = primary_ppt_tka,
         `MTS (index)`      = primary_ts_index_tka,
         `MTS (remote)`     = primary_ts_remote_tka,
         `CPM (% change)`   = primary_cpm_tka)

primary |>
  pivot_longer(-record_id, names_to = "biomarker", values_to = "value") |>
  filter(!is.na(value)) |>
  ggplot(aes(value)) +
  geom_histogram(bins = 30) +
  facet_wrap(~biomarker, scales = "free") +
  labs(title = "Distributions of primary QST biomarkers (TKA)", x = NULL, y = "Count") +
  theme_minimal()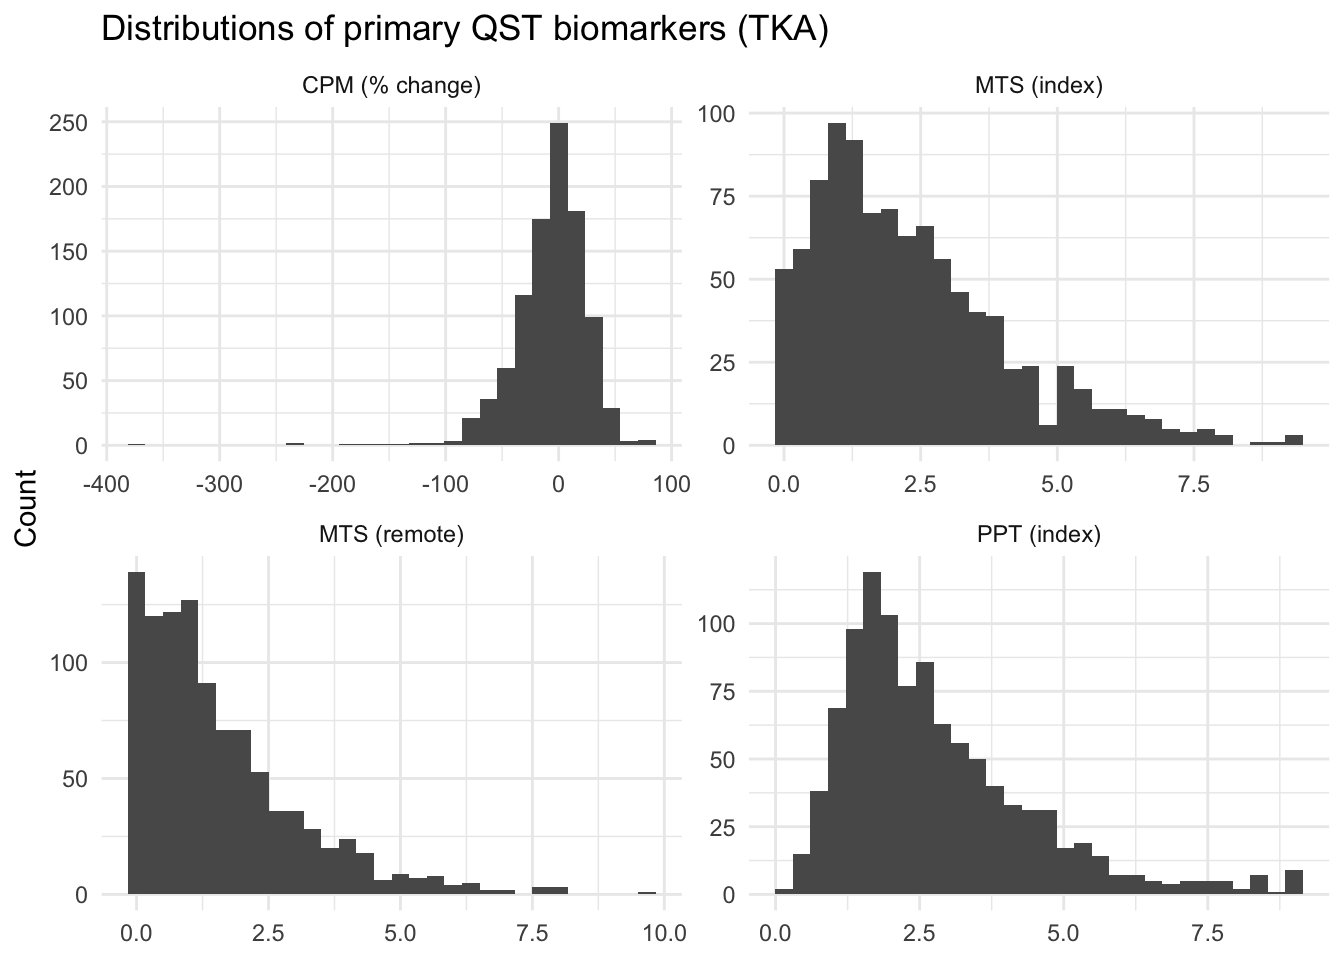
On average, PPT is lower at the index (surgical) site than at the remote site (≈ 2.8 vs. 3.2), which fits with the surgical site being more sensitive. The CPM panel also makes the heavy tail from the % change easy to see.
Next we look at how the biomarkers relate to one another using a spearman (rank-based) correlation using pairwise-complete observations.
primary |>
  select(-record_id) |>
  cor(method = "spearman", use = "pairwise.complete.obs") |>
  round(2)
PPT (index) MTS (index) MTS (remote) CPM (% change)
PPT (index) 1.00 -0.18 -0.18 -0.09
MTS (index) -0.18 1.00 0.64 0.01
MTS (remote) -0.18 0.64 1.00 0.03
CPM (% change) -0.09 0.01 0.03 1.00The pattern is informative. The two MTS sites are strongly correlated (≈ 0.64), i.e., a participant who summates at the knee tends to also summate at the shoulder. Otherwise, PPT, MTS, and CPM are close to independent (correlations near zero, with a weak negative link between PPT and MTS). So the assays are not redundant. Each biomarker adds its own information about a participant’s pain-processing profile, and that is exactly why A2CPS collects all three rather than a single summary of “pain sensitivity”.
2.3 Considerations While Working on the Project
2.3.1 Data Generation
QST is administered in person by trained study staff, following the A2CPS Manual of Procedures, which specifies the algometer and Neuropen procedures, the cold-water CPM protocol, the index and remote testing locations, and the double entry of every pain rating. Raw responses are captured in REDCap. The steps that turn the REDCap export into the reformatted files (filtering, deduplication, error checking, and computing the PPT, MTS, and CPM biomarkers) are documented in the cleaning workflow that comes with the release (QSTCRF_data_quality_checks_and_reformat.html).
2.3.2 Other
- Directionality matters. Higher PPT means less sensitivity, higher MTS means more facilitation, and negative CPM points to inhibition. A flipped sign quietly reverses a result, so the table above is a handy reference.
- MTS and WUR are non-negative by construction. The difference and wind-up scores use
max(final, initial)in place of the recorded maximum, so they never fall below 0 (difference) or 1 (wind-up ratio). This includes a handful of records where the recorded maximum was below the initial rating, but it is worth knowing when reproducing the values. - Cohort-specific field names. The TKA and thoracic files use different underlying REDCap field names (for example, the double-entry suffixes differ), and the thoracic cohort also includes a Dynamic Mechanical Allodynia assessment. The biomarker columns are harmonized across cohorts, so they tend to be the easier starting point when comparing the two.
- Quality control. The biomarker code has been reviewed and independently derived from the raw pain ratings, and the error report shows which records were flagged during cleaning.
2.3.3 Citations
In publications or presentations including data from A2CPS, please include the following statement as attribution:
Data were provided (in part) by the A2CPS Consortium funded by the National Institutes of Health (NIH) Common Fund, which is managed by the Office of the Director (OD)/Office of Strategic Coordination (OSC). Consortium components and their associated funding sources include Clinical Coordinating Center (U24NS112873), Data Integration and Resource Center (U54DA049110), Omics Data Generation Centers (U54DA049116, U54DA049115, U54DA049113), Multi-site Clinical Center 1 (MCC1) (UM1NS112874), and Multi-site Clinical Center 2 (MCC2) (UM1NS118922).
Note
Berardi, G., Frey-Law, L., Sluka, K. A., Bayman, E. O., Coffey, C. S., Ecklund, D., Vance, C. G. T., Dailey, D. L., Burns, J., Buvanendran, A., McCarthy, R. J., Jacobs, J., Zhou, X. J., Wixson, R., Balach, T., Brummett, C. M., Clauw, D., Colquhoun, D., Harte, S. E., … Wandner, L. D. (2022). Multi-site observational study to assess biomarkers for susceptibility or resilience to chronic pain: The acute to chronic pain signatures (A2CPS) study protocol. Frontiers in Medicine, 9. https://doi.org/10.3389/fmed.2022.849214
Sluka, K. A., Wager, T. D., Sutherland, S. P., Labosky, P. A., Balach, T., Bayman, E. O., Berardi, G., Brummett, C. M., Burns, J., Buvanendran, A., et al. (2023). Predicting chronic postsurgical pain: Current evidence and a novel program to develop predictive biomarker signatures. Pain, 164(9), 1912–1926. https://doi.org/10.1097/j.pain.0000000000002938